An Energy Data Management System

About the client
Andersen was approached by a company operating in the energy sector. This large-scale business runs 45 subsidiaries and four affiliated firms with 3,500 employees. The chief goal of the company is to transmit and distribute electricity.
![[object Object] on the map](https://static.andersenlab.com/andersenlab/new-andersensite/bg-for-blocks/about-the-client/germany-desktop-2x.png)
Project overview
Andersen was approached by a company operating in the energy sector. This large-scale business runs 45 subsidiaries and four affiliated firms with 3,500 employees. The chief goal of the company is to transmit and distribute electricity. It is not an exaggeration to say that 50% of electricity produced globally is managed via the company's products, services, and facilities.
Namely, the customer helps its clients — i.e., energy producers, public and industrial grid operators, and transformer manufacturers — with smart solutions and tools to control load flow and power quality for a seamless power supply. The range of products includes on-load and de-energized tap-changers, innovative sensors, automation technology and analytics tools, and digital solutions.
Andersen was entrusted with building a data management and processing system to support the customer's global operations.

Challenges
In general, Andersen's mission in this business case was to help the customer modernize and upgrade the way it handled data:
- Transition from TSLint to ESLint with subsequent migration from Angular 11 to Angular 13;
- Export of all data from the application to CSV files;
- Rotation of pictures and a capability to save altered and compressed images and display them in reports.
Solution
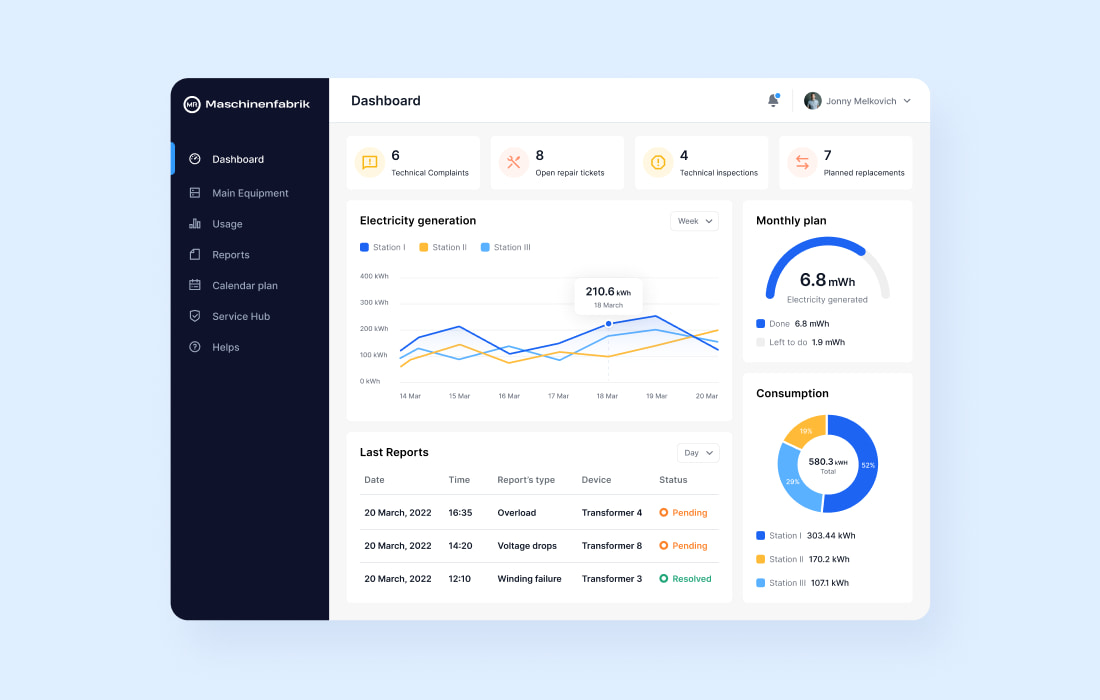
Andersen has successfully delivered a reliable and industry-specific application capable of collecting and processing electricity data, generating graphs, and displaying information in the required fashion.

App functionality
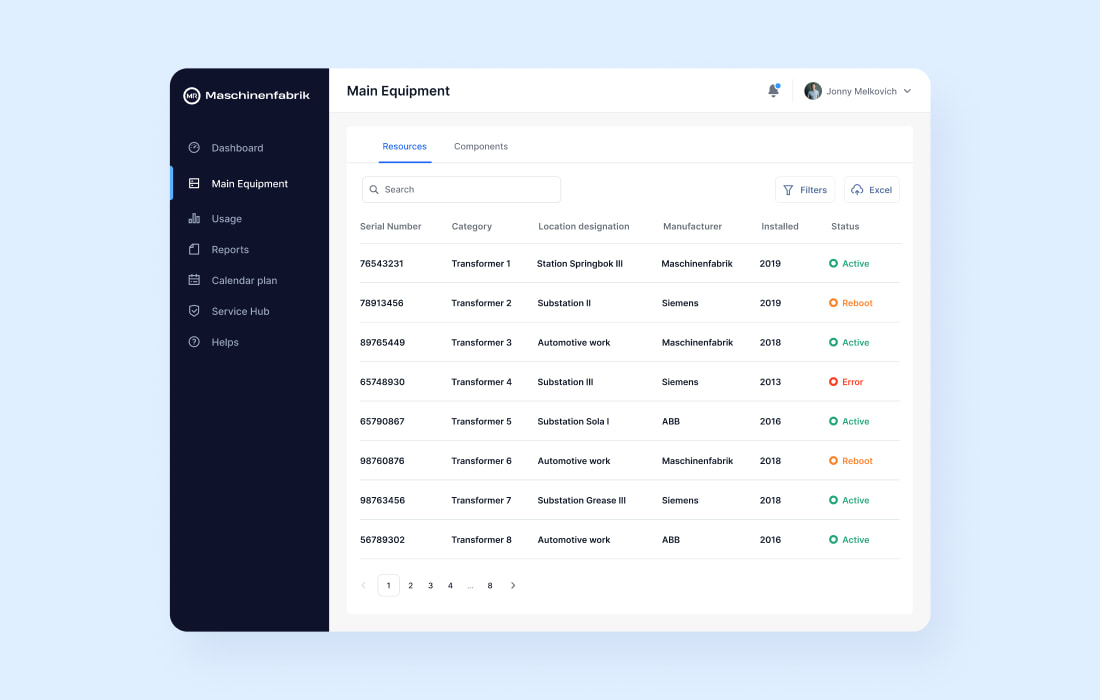
The result of Andersen's effort can be described as an enterprise-grade application collecting data from electrical transformers and generating reports based on it. With this solution at their disposal, the customer's employees can quickly obtain graphs and tables covering the risks of transformer component failures, as well as recommendations based on those risks.
The tool built by Andersen is, in particular, notable for its ability to work with images. It can upload, download, delete, rotate, drag, drop, and add them to reports. As for the range of available file formats, the tool offers PDF, CSV, and XLSX files.
Finally, this solution displays all data-generation transformers on the map and can function offline thanks to a special library that synchronizes the database and IndexedDB data.
Project results
- The implemented innovative data management system has led to a 30% reduction in component failures and a 40% reduction in repair and maintenance costs;
- Advanced image processing capabilities allow for easy manipulation of images;
- Streamlined operations and cost savings have enhanced the customer's ability to transmit and distribute electricity.
Let's talk about your IT needs
What happens next?
An expert contacts you after having analyzed your requirements;
If needed, we sign an NDA to ensure the highest privacy level;
We submit a comprehensive project proposal with estimates, timelines, CVs, etc.
Customers who trust us


