


- A summary of BA artifacts and their role
- Rationales behind visualizing the requirements in the context of business analysis artifacts
- What exact business analysis artifacts do BAs generate via visualization?
- Wrapping up. Contact Andersen for business analysis services
It would be logical to start this piece on the compelling reasons to visualize business analysis artifacts with a universally acknowledged truism: "A picture is worth a thousand words." Despite its apparent simplicity, this statement holds both profound and undeniable implications. As humans, we find it much easier to comprehend abstract concepts when we can see them, viewing the situation through a series of visual representations.
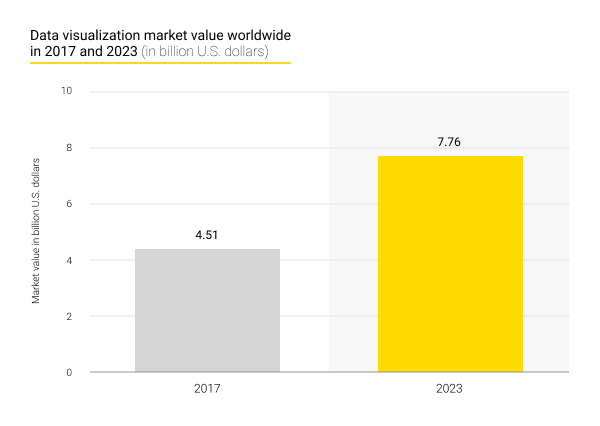
For instance, in this image you can clearly see how the global value of the data visualization market grew from slightly over $4.5 billion back in 2017 to almost $7.8 billion last year.
As a custom software company, we at Andersen are understandably interested in how visualization helps engineer cutting-edge and feature-packed solutions. Here, we will attempt to highlight how BAs (and the business analysis artifacts they are responsible for) use visualization. Hence, we will shed some light on the existing types of visual documents pertaining to BAs. In addition to that, we will assess the contributions that graphical representations can make to your eventual total success (or at least to avoiding costly software project failures, which unfortunately happen from time to time).
Did you know: Per the American Management Association, the utilization of “visual language” can reduce meeting durations by almost one quarter. This time can, as a result, be spent by attendees and participants on more meaningful core activities.
A summary of BA artifacts and their role
Extensive available findings underscore the critical significance of amply documented needs in fulfilling customers' expectations concerning future functionalities. To steer clear of expensive, time-consuming, and tedious redesigns and reworks, it is imperative to involve a BA who is proficient in crafting and maintaining business analysis documentation for your IT initiative.
Indeed, thorough assessment and documentation of must-haves are both vital for ensuring productive delivery. The advantages of business analysis comprise:
- Enhanced traceability;
- Streamlined troubleshooting procedures;
- Maintained consistency.
As for the applicable and relevant examples of artifacts in business analysis, we could cite an extensive list. Such a range comprises meeting agendas, follow-up emails, Vision & Scope docs, specs, user stories as well as user journey maps and, finally, use cases.
When discussing visualization-specific issues below, we will concentrate on requirements, as this aspect is of paramount importance.
Did you know: As per MIT scientists, it takes our brain as little as 13 milliseconds to process an image we see.
Rationales behind visualizing the requirements in the context of business analysis artifacts
Conventional wisdom makes it inevitable that the more sophisticated a given architecture gets, the more detailed and ordered the visualization of its every part must be. Functional requirements in business analysis, when presented graphically, transmit some classes of information more competently than text. For instance, it is less strenuous to outline a system’s data flows via diagrams and interface details via wireframes and prototypes, instead of reading dozens of lengthy text docs.
We invite you to reflect on these three positive outcomes.
Comprehensive perspectives on a system’s functionalities — an analysis.
Atomic requirements, encapsulated within a Business Analyst's documentation, delineate the system's design, testing procedures, and workflow management. While these detailed requirements do offer undeniable benefits to an IT initiative, they come with a significant drawback.
Such BA artifacts often hinder stakeholders from grasping the system's entirety and clearly comprehending the intended logic and capabilities. Instead, all the decision-makers can perceive is an extensive text-based “to-do” list without a clear understanding of execution specifics.
Visualized requirements, presented by a BA, provide customers with insight into the product's scale, complexity, and functionalities in a more digestible fashion. This visibility plays a crucial role in accurately estimating budget allocations and timeframes. Moreover, the graphical representation of a solution serves as the initial phase in turning vague requirements into a well-crafted product.
Verification of requirements — an analysis.
Through the visualization of requirements, business analysis professionals are placed in the right position to pinpoint errors, comprehend missing requirements, and ensure E2E coverage of the designed functionalities via use cases.
Despite the temptation to commence engineering activities immediately after eliciting and documenting requirements, it would be much more sound to recognize that, at the initial phases of a lifecycle, the concept being designed often contains flaws and fallacies. This is primarily due to the absence of end-user and customer feedback, coupled with potential misunderstandings within the development group, regarding the product goals.
The aim of visualizing the functional essentials is to construct a holistic representation of business-wide flows and end-user flows, encompassing all possible scenarios. This process aids BAs in uncovering overlooked facets of functionality, securing logical consistency within the designed model.
Swift feedback from those involved — an analysis.
Within the Agile framework that we practice as a hub of custom enterprise software development expertise, close interaction between customers and engineering teams is pivotal for guaranteeing workable cooperation and the delivery of a worthwhile product. Agile-based initiatives, by definition, mandate continuous and seamless communication, regularly occurring demo meetings, the extraction of actionable insights, and the collection of user feedback.
Against this backdrop, visualized documents, crafted by a BA, facilitate quick reviews and responses from customers. This enables swift updates to the digital product based on fresh guidelines. Consequently, projects progress flexibly, allowing for the adoption of new approaches.
Did you know: Research indicates that within organizations utilizing visual data discovery tools, close to half of the decision-makers can autonomously access the required information without relying on assistance from IT personnel.

What exact business analysis artifacts do BAs generate via visualization?
What is the mission of a business analyst? Artifacts need to be created, but of what sort? Generally, there exist five classes of artifacts in business analysis. Our company presents them this way.
Diagrams as artifacts concerning business analysis
The task of all diagrams is to represent particular processes within a system schematically. In the capacity of artifacts, these diagrams might vary, dependent on:
- Their abstraction level, e.g. high-level or detailed diagrams;
- Their language or notation that is utilized for modeling. To clarify, diagrams either build upon the Unified Modeling Language (UML) or on Business Process Model and Notation (BPMN);
- Finally, types of system representation, encompassing structural, behavioral, and interactive forms.
Based on our actual business practice, we can boil down the most popular diagrams to:
- First, activity diagrams that model business workflows as a list of actions and their consequences;
- Second, entity-relationship diagrams, illustrating versatile interactions of the different entities involved, e.g. objects, concepts, and human end-users within a system;
- Third, use case diagrams, showcasing possible interactions undertaken between an end-user and a system;
- Fourth, class diagrams, explaining the system’s structure by showing its classes, their attributes, operations, and relationships between objects;
- Sixth, statechart diagrams, depicting transitions between the states of an entity when a specific event happens;
- Seventh, sequence diagrams that arrange process interactions chronologically, illustrating their temporal sequences;
- Eighth, E2E diagrams, portraying the entire business process with all possible alternative scenarios and being leveraged for high-level modeling or when onboarding new staff members;
- Ninth, BPMN diagrams, describing processes by means of a frequently used language, which is helpful when project participants are determined to avoid communication gaps.
Value from artifacts: Every diagram has its purpose, helping BAs conceptualize the requirements at the best matching level of abstraction and identify where information is missing.
Average artifact preparation time for our BAs: One to three days.
Analytical models as artifacts concerning business analysis
An analysis model serves as a potent instrument crafted to comprehensively depict the facets of a problem and ascertain the optimal approach to fulfilling a specific set of user demands. It encompasses pivotal concepts, dimensions, and indicators essential for characterizing a research domain. As a tool, it equips BAs with a structured framework of observations and insights, crucial for scrutinizing particular demands.
Some widely utilized analysis models encompass:
- First, a product roadmap, delineating the engineering trajectory, features, and the progress of a digital product;
- Second, the business analysis approach, elucidating strategies for activity planning in business analysis and achieving desired outcomes;
- Third, the SWOT analysis model, discerning the strengths, weaknesses, opportunities, and threats;
- Fourth, the PESTLE analysis model, evaluating diverse factors, their potential impact on the product, duration, influence type (positive or negative), and significance level;
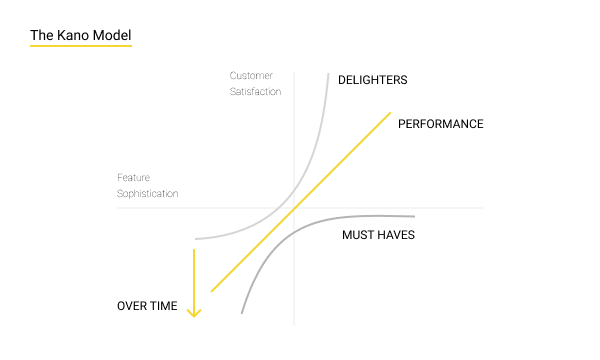
- Fifth, requirements prioritization models like the Kano model and Pareto chart, aiding Business Analysts in dissecting and prioritizing requirements based on specific metrics and predefined criteria.
- Sixth, a persona encapsulates the shared interests, needs, behavioral tendencies, and expectations of a specific group of end-users who engage with the product in a similar manner;
- Seventh, benchmarking utilizes charts, graphs, and dashboards to visually present market analysis findings, comparing the designed product with rivals' offerings in an easily understandable format;
- Eighth, a conceptual data model organizes data pertinent to business processes and performance gauges.
Value from artifacts: Analysis models enable project stakeholders to conceptualize information about the designed digital solution and glean valuable insights through user-friendly templates. Such documents, crafted by BAs, aid project participants in determining product plans, spotting expansion opportunities, and pinpointing areas of concern warranting meticulous attention.
Average artifact preparation time for our BAs: One to three days.
Matrices as artifacts concerning business analysis
Being in high demand, various variants of matrices are widely utilized, including:
- The requirements traceability matrix, which establishes links between product requirements throughout their lifecycle, from identification to fulfillment. This matrix guarantees that documented findings align with stakeholder expectations;
- The RACI matrix, delineating task goals and the requisite actions from each involved individual to accomplish them. This aids in defining areas of responsibility and assigning tasks to staff.
Value from artifacts: Matrices facilitate thorough analysis of requirement changes, enabling informed decisions regarding product engineering. Moreover, they foster efficient communication among personnel and stakeholders, ensuring clarity regarding responsibilities and a shared understanding of project-related adversities and prospects.
Average artifact preparation time for our BAs: Up to two days.
Wireframes and mockups as artifacts concerning business analysis
A wireframe serves as a schematic blueprint illustrating the planned structure, emphasizing content prioritization, operable features, space allocation, and desired conduct.
On the other hand, a mock-up presents a high-fidelity representation of the design, offering a detailed preview of the eventual appearance. Compared to wireframes, mock-ups entail more intricate detailing and require a longer time investment for creation.
Value from artifacts: These artifacts play an integral part in engineering, aiding coders and UI/UX experts in conceptualizing the structure and interface. They also facilitate effective communication between team members during the development. By creating these documents before finalizing visual designs and writing code, Business Analysts can prevent pricey overhauls.
Average artifact preparation time for our BAs: Ranging from several days to approximately a week.
Prototypes as artifacts concerning business analysis
Typically, any prototype stands as a fundamental operational rendition of a digital product or information system. The latter is usually fashioned to showcase and lay the groundwork for forthcoming engineering endeavors. It empowers Business Analysts to delve into alternative designs, to subject functionalities to tests, and to enhance features before full-scale engineering activities begin.
Value from artifacts: Prototypes aid project partakers in understanding the project's concept and facilitate collaborative idea exchange with clients. They also facilitate early feedback from customers and end-users, allowing for timely adjustments to the solution's design to optimize outcomes.
Average artifact preparation time for our BAs: Ranging from a couple of days to approximately a week.
Did you know: As researchers from the International Forum of Digital Practitioners remind us, the human brain actually processes visual information 60,000 times faster than textual content.
Wrapping up. Contact Andersen for business analysis services
Dependable visual artifacts crafted by BAs deliver significant benefits to both customers as entities and individual engineering teams. Such graphical depictions streamline the product building process and mitigate the risk of expensive and prolonged revisions for clients.
By integrating Andersen's skilled BAs into your team, you'll obtain digital solutions, meticulously envisioned and engineered to align with your expectations. This will concurrently fulfill end-users' requirements and greatly enhance efficiency.
Reach out to us for assistance in dissecting business requirements and creating comprehensive documentation to ensure the successful execution of your project. What can you expect from all of our business analysts? Artifacts of the highest quality possible. Analysis is one of our key areas of operation, after all. And we never forget that visual information constitutes 90% of all the aggregated data transmitted to our brains.
P.S. Did you know: Utilizing visuals has led to a 21% uptick in the consensus-building capabilities of groups, surpassing those that abstained from visual aids. The rapid attainment of consensus and subsequent progression towards action stands as a pivotal determinant of success.


