Marketing analytics platform

Hilda Randall
Business relationship manager at Parabellum
"Andersen was a great business partner to work with"
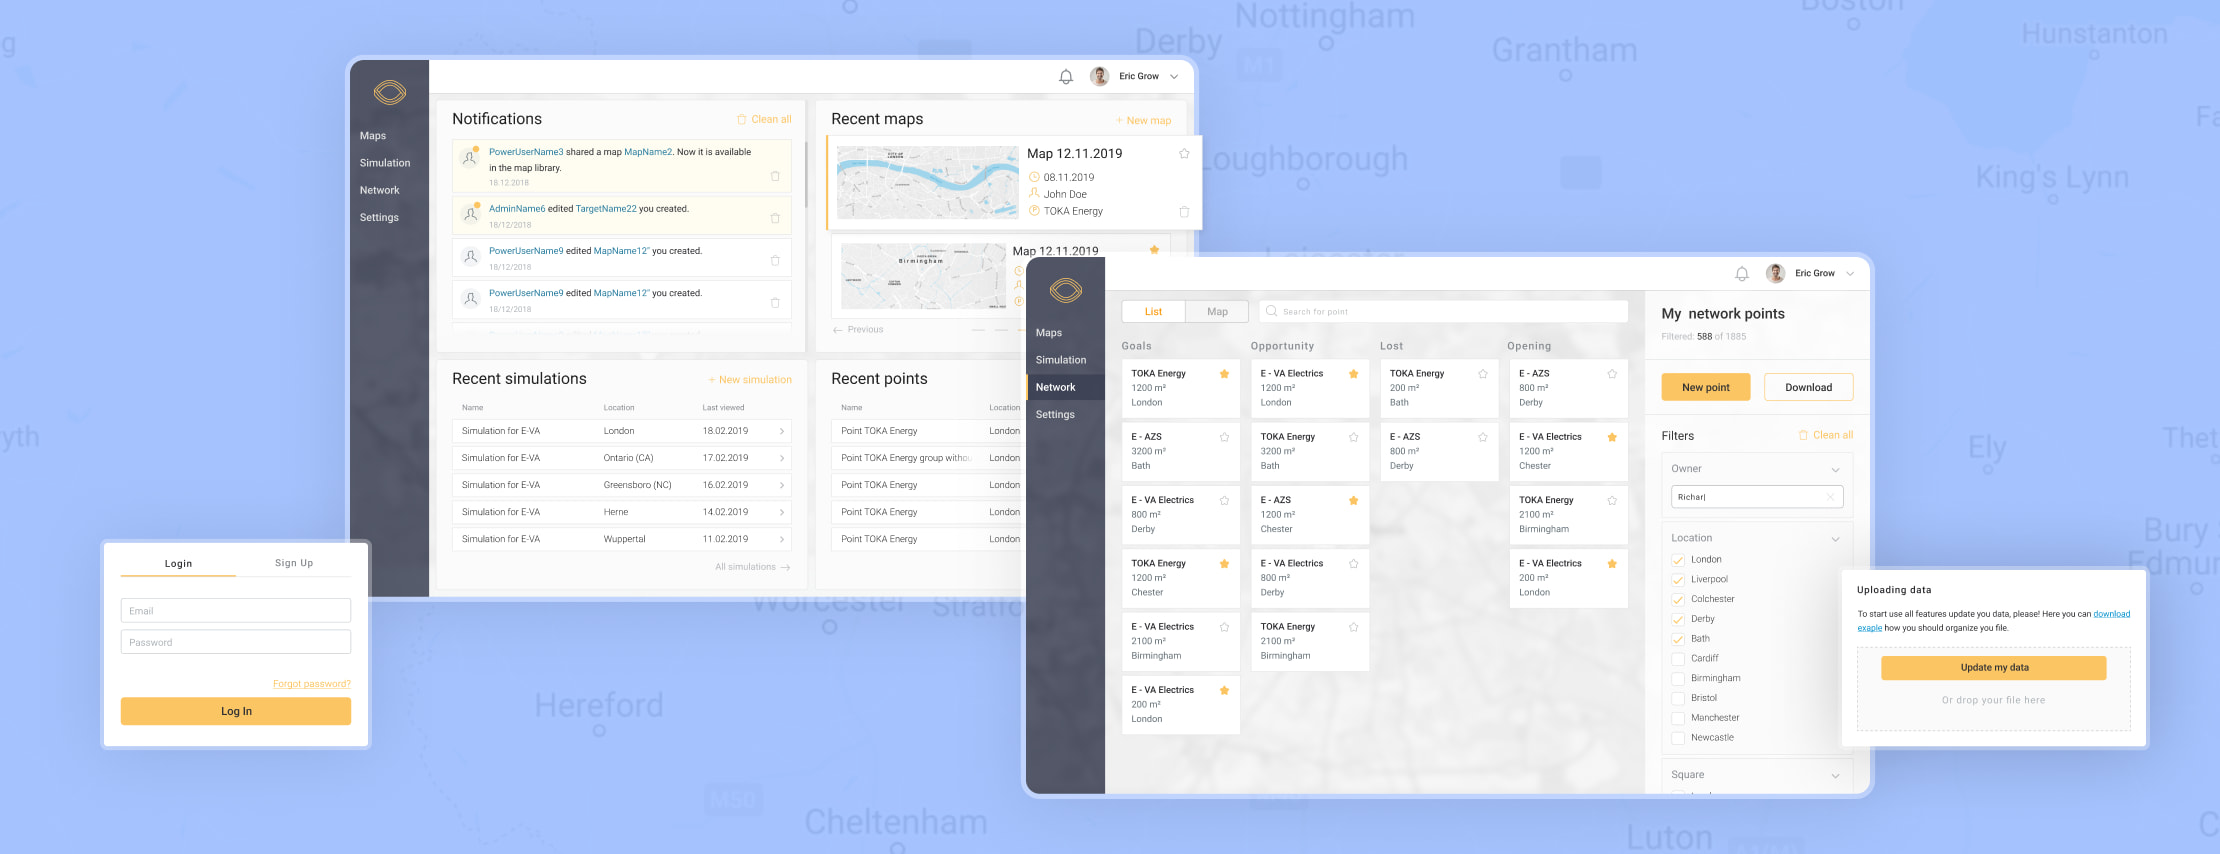
UX-research
The customer came to us with the ready-made templates of the software design. At the very start of the cooperation, we conducted a thorough study of the customer’s idea and the suggested software mock-up. Then, together with the customer, we elaborated the final concept of an interface for the future product.
UI-system
The result of joint efforts is the most convenient interface based on the customer’s idea and Andersen’s expertise. Together, we chose a white background, gentle but at the same time contrast colors, simple minimalistic icons, a necessary minimum of buttons, checkboxes, and imputes.
Colors

Buttons

Checkboxes and radio buttons

Icons

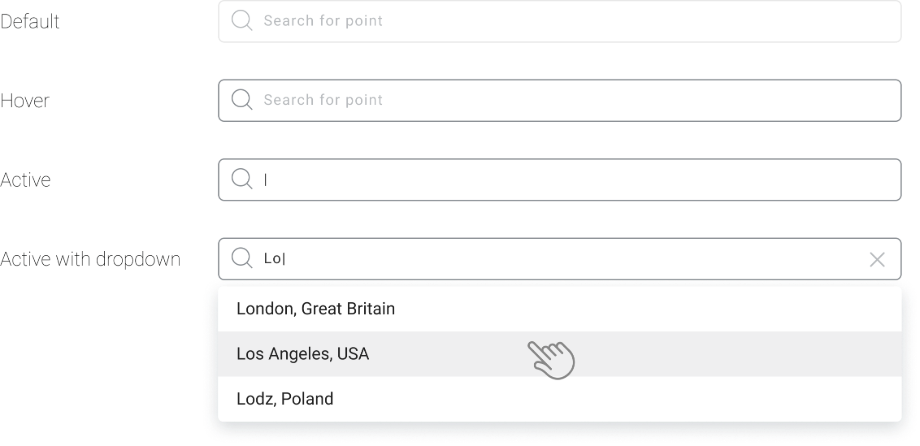
Inputs
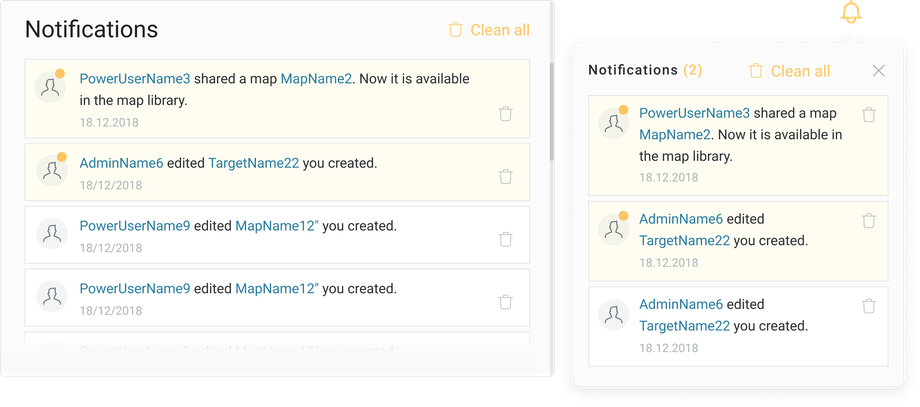
Notifications
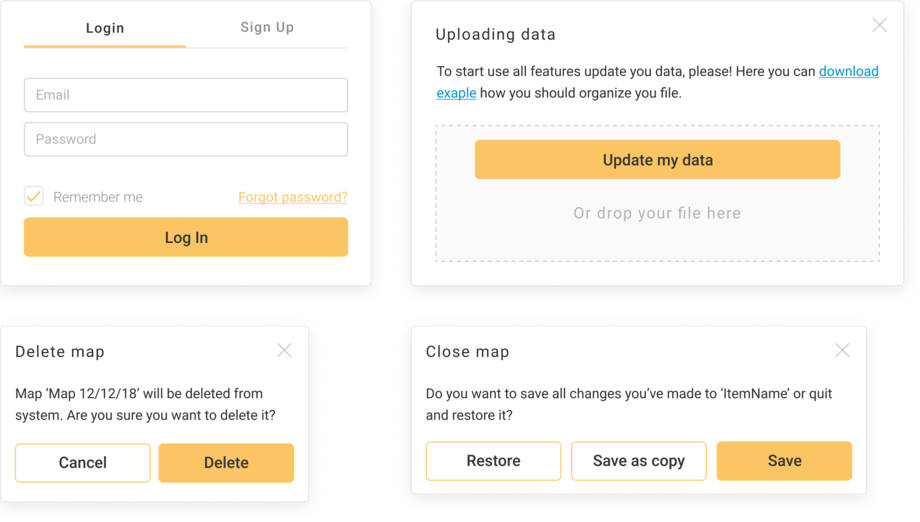
System popups
Dashboard
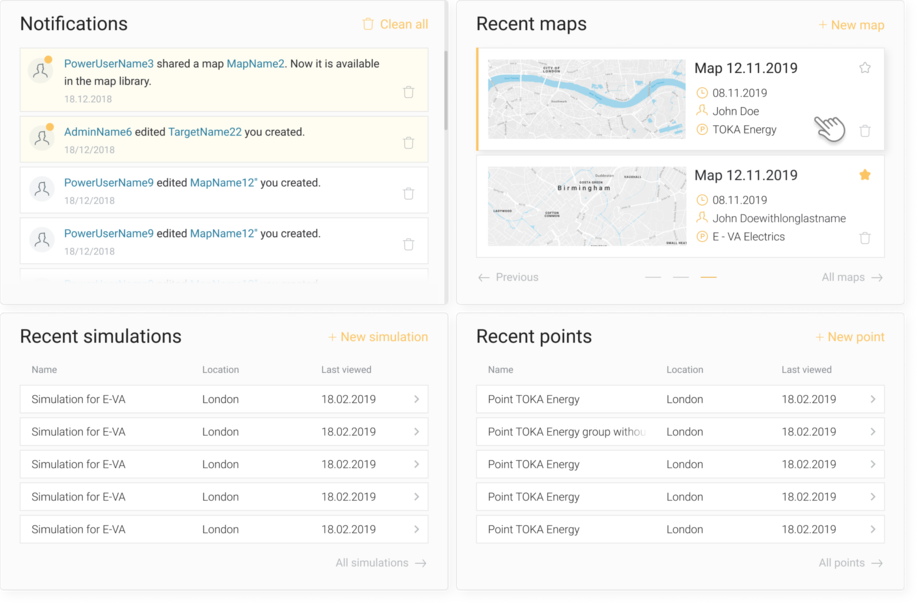
After launching the application, the user sees a dashboard with four widgets, which ensures the quick start of work. These widgets are notifications about recent events, a block with maps created recently, lists of simulations and points of sales.
Maps list
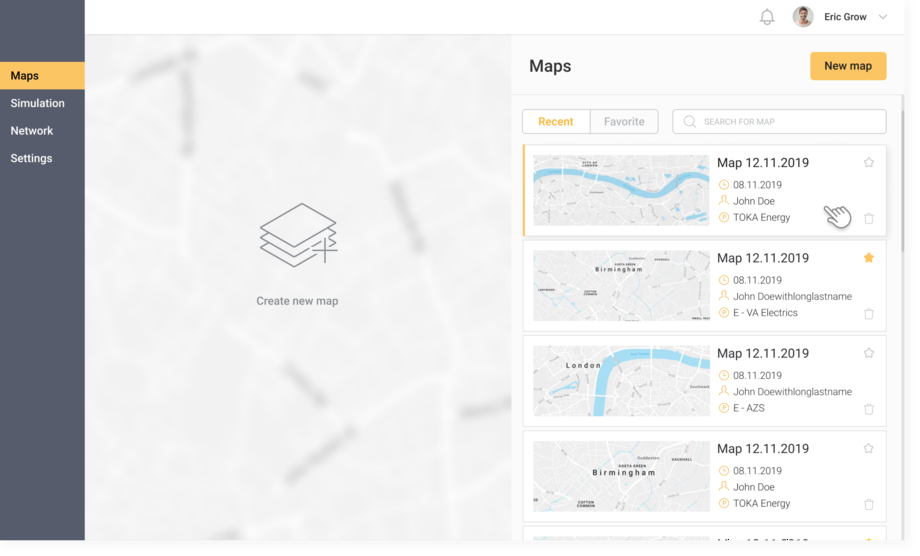
Clicking on a Recent maps widget, the user goes to Maps-list divided into two blocks. The left block suggests the client create and add a new map; on the right block, there is a list of all user’s maps, as well as filters so that the needed map can be found within few seconds.
Map
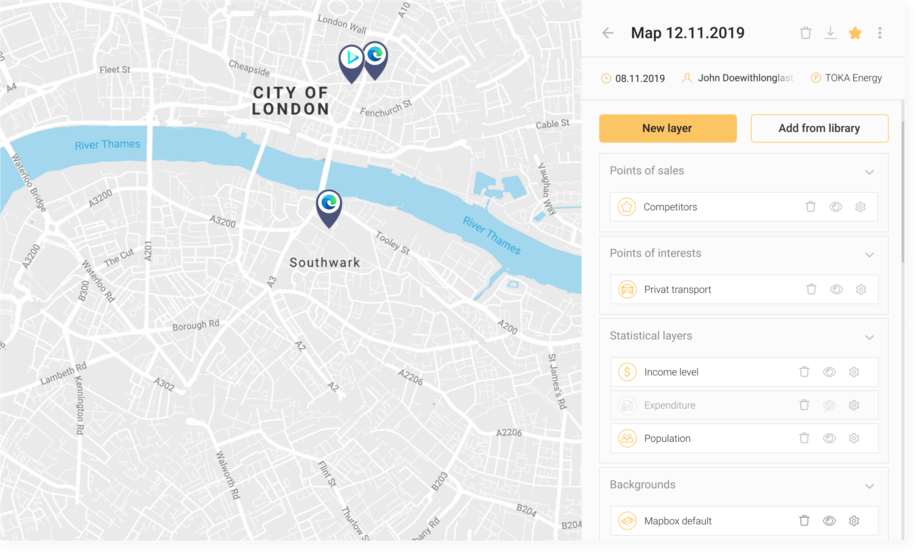
Here, a suitable place for opening a new POS can be chosen. Next to the map, there is a tools panel that allows for applying various layers on a selected area, which show such important details as the local population, children, income, traffic, malls, car parks, tourist attractions, etc. Besides, the functionality gives the possibility to switch the display mode from cartographic to satellite one.
Simulation
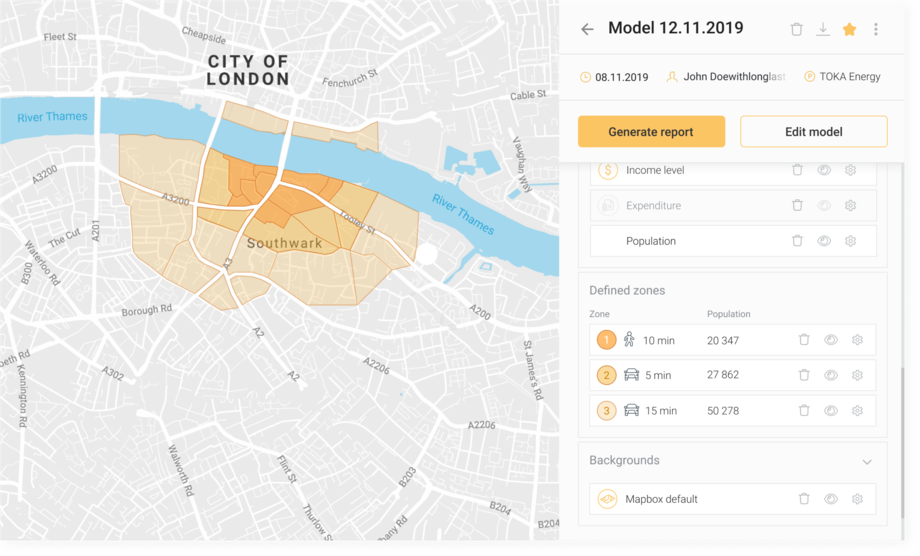
The main feature of the application is a modeling of the potential turnover of the chosen point. After defining the promising place and setting all the necessary parameters such as layers and distance, the user can get a report on the potential annual turnover of the given POS. Therefore, the application eliminates the necessity to gather statistical data and generate the corresponding report manually.
My networking points
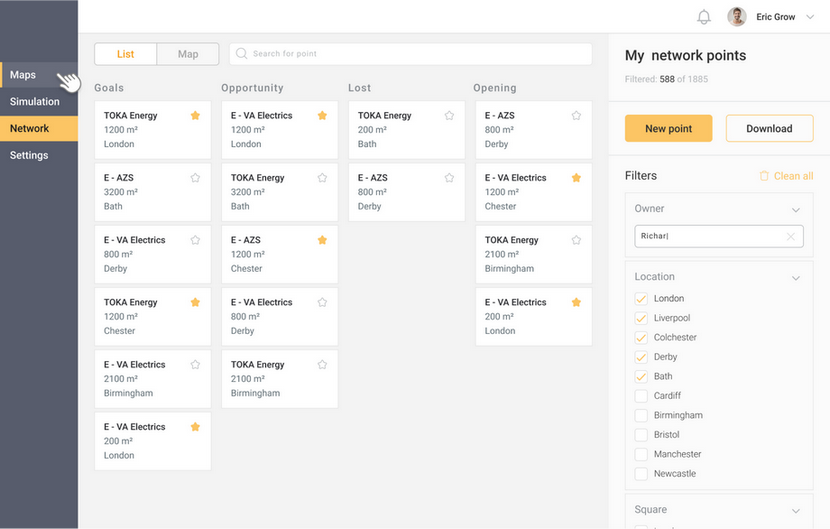
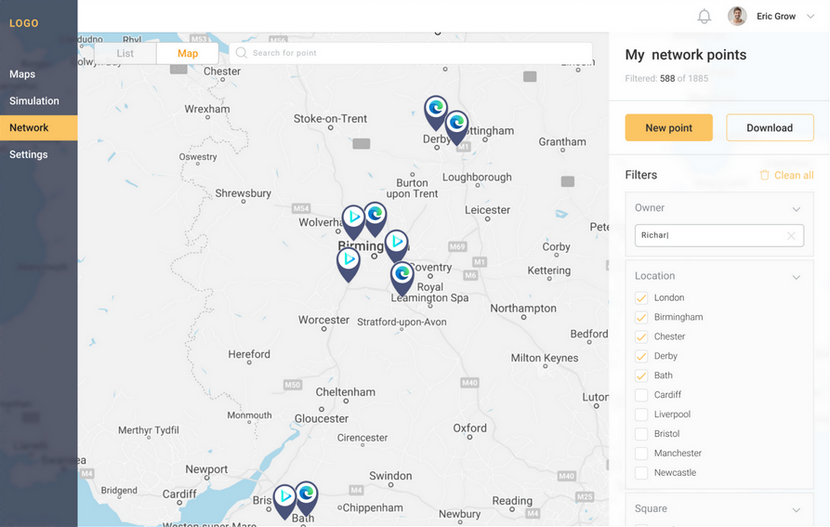
A list of all points of sales belonging to the user's enterprise. The list is divided into several columns depending on the status of a POS: those defined as goals, those being worked on, those that are about to open, and those that were not opened for some reason.
Short view
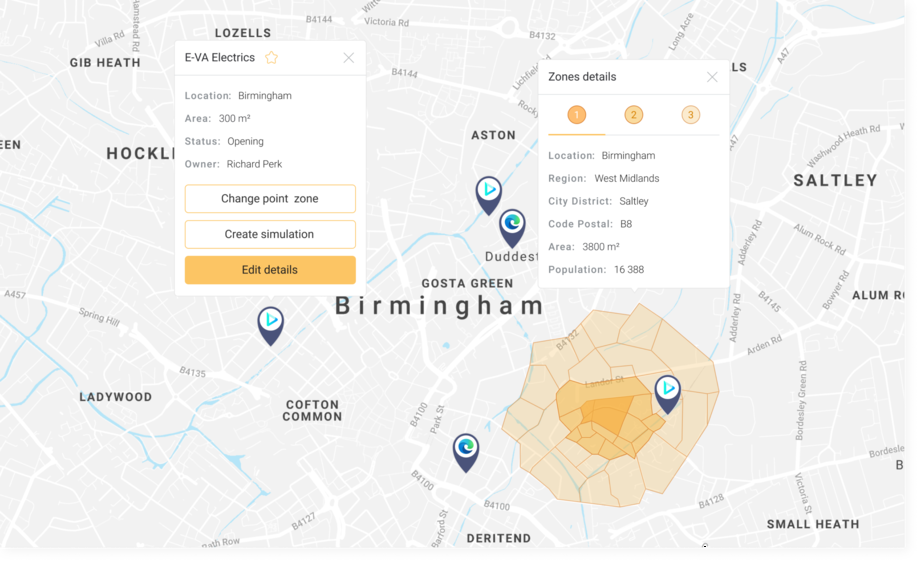
Clicking on a pinpoint on the map, the user sees the detailed information about the given point of sale.
Project results
Working closely with the customer, we have managed to envision a user-friendly interface that is not only visually appealing but also intuitive and efficient. The key features of the app, such as the ability to model the potential turnover of a chosen point of sale, provide valuable insights and save time and effort for the business.
Customer review
Andersen was a great business partner to work with. Its team provided expert advice on all phases of our analytical app development, were extremely supportive and responsive to all the queries, and delivered a high-quality market product.

Hilda Randall
Business relationship manager at Parabellum
Let's talk about your IT needs
What happens next?
An expert contacts you after having analyzed your requirements;
If needed, we sign an NDA to ensure the highest privacy level;
We submit a comprehensive project proposal with estimates, timelines, CVs, etc.
Customers who trust us


